Illustration
Here is the kind of difference you can get simply by changing the saving command: R-code
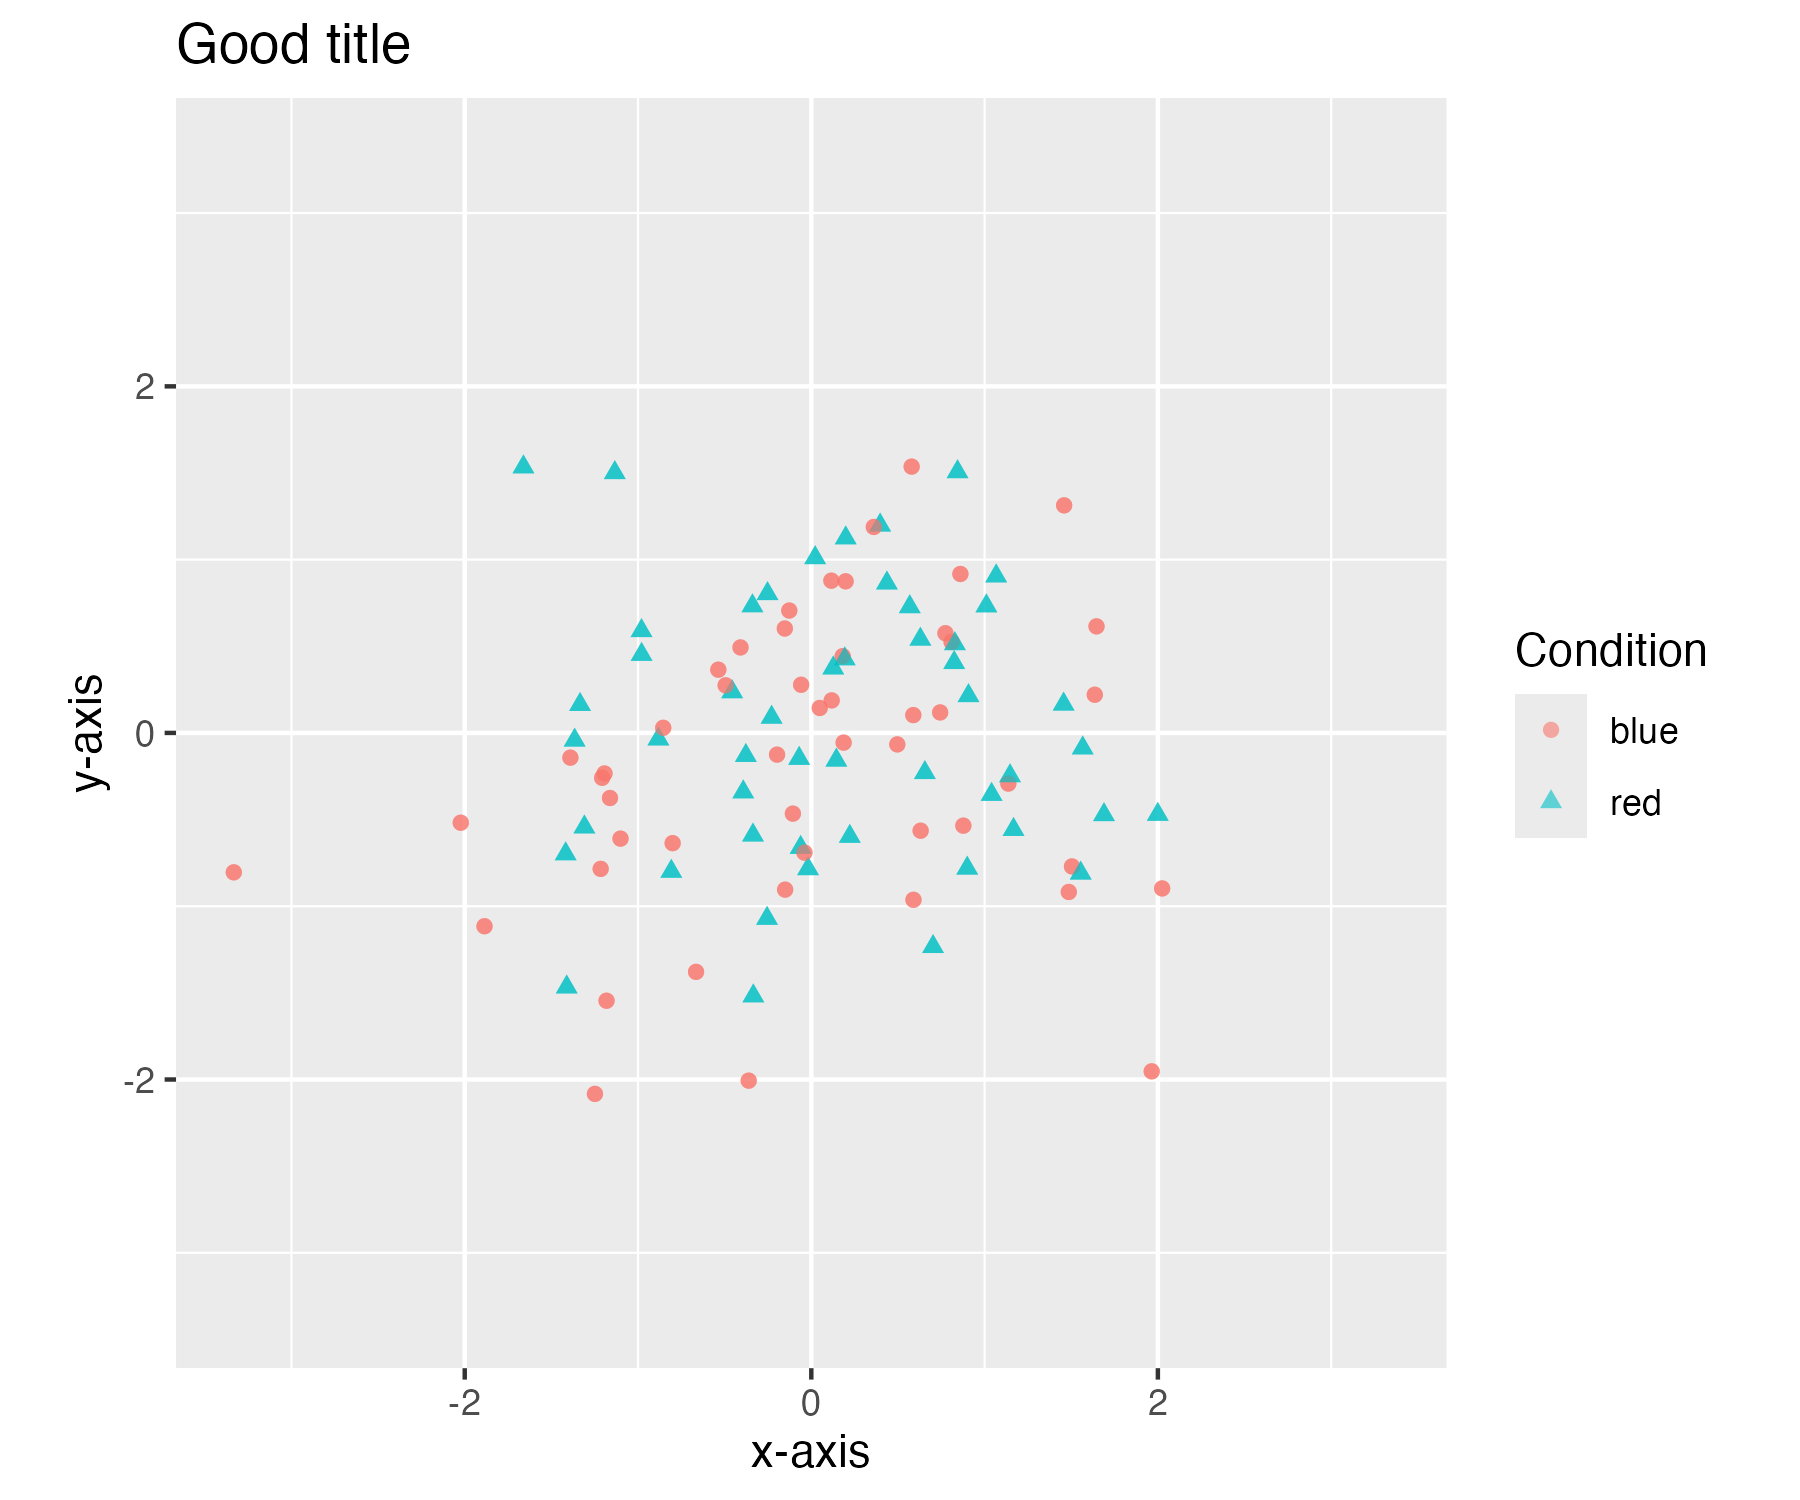
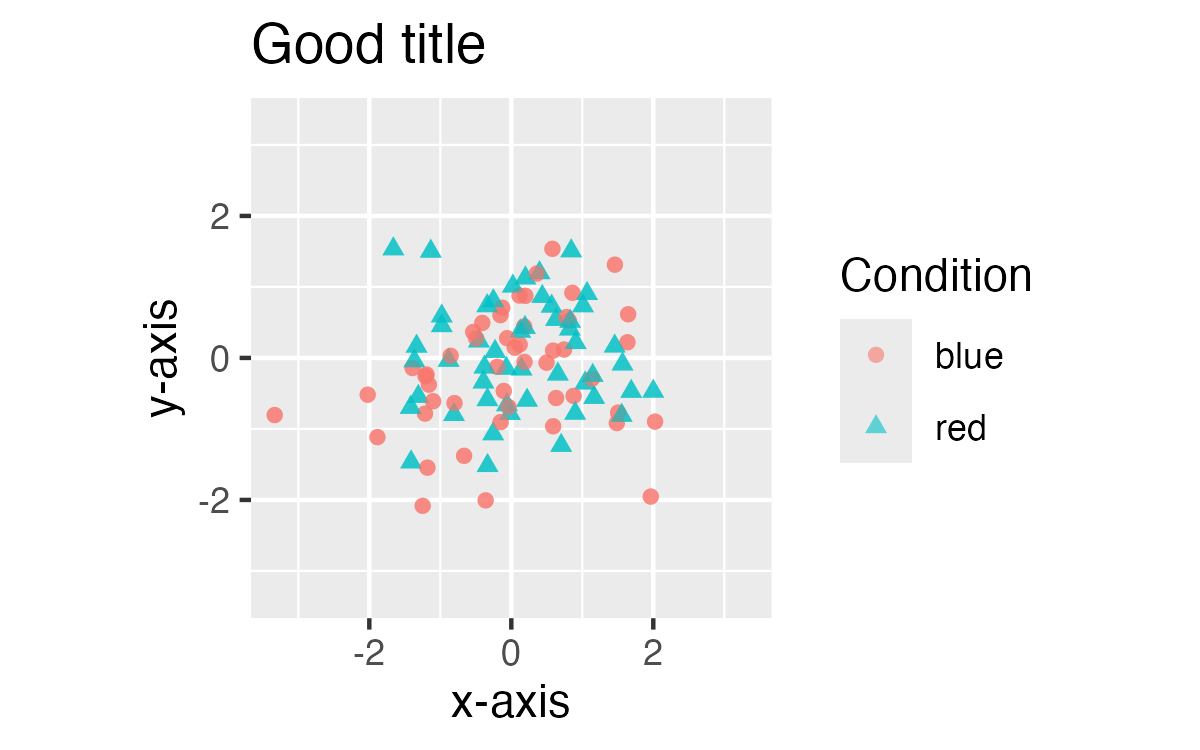
One common problem with graphs created in R is that many elements end up being too small for their target usage. On slides or in papers, it’s often very hard to read text elements such as legends, axes labels, etc. There is a fairly simple solution to this. If you know in advance the final size of your graph in your paper, you can tell R, and it will make appropriate size decisions for you.
Here is the kind of difference you can get simply by changing the saving command: R-code
[You can skip the first step if you know how to manipulate plotting windows.]
ggsave does this perfectly well.
ggsave), but not if the default values are fixed (e.g., the 7in default for quartz.save).
Combining Option 1 and Option 2, you can see that the key in Option 1 is that the default size for the saving function in the R menu uses the size of the current plotting window to define the size of the graph you save. What you see is what you save.